An action title is the headline of a slide written as a full sentence that states what the slide proves. "Churn analysis" is a topic title. "Churn concentrates in the first 90 days, so onboarding is the lever, not loyalty pricing" is an action title: it gives the finding, the evidence to look for, and what it means for the decision.
This page is the practical companion to the Pyramid Principle worked example and the MECE storylining guide. Those articles cover how to structure the storyline. This one is about the sentence at the top of each slide: five tests, a formula, 30 before-and-after examples by slide type, the ghost deck technique, AI prompts, and a free editable slide pack.
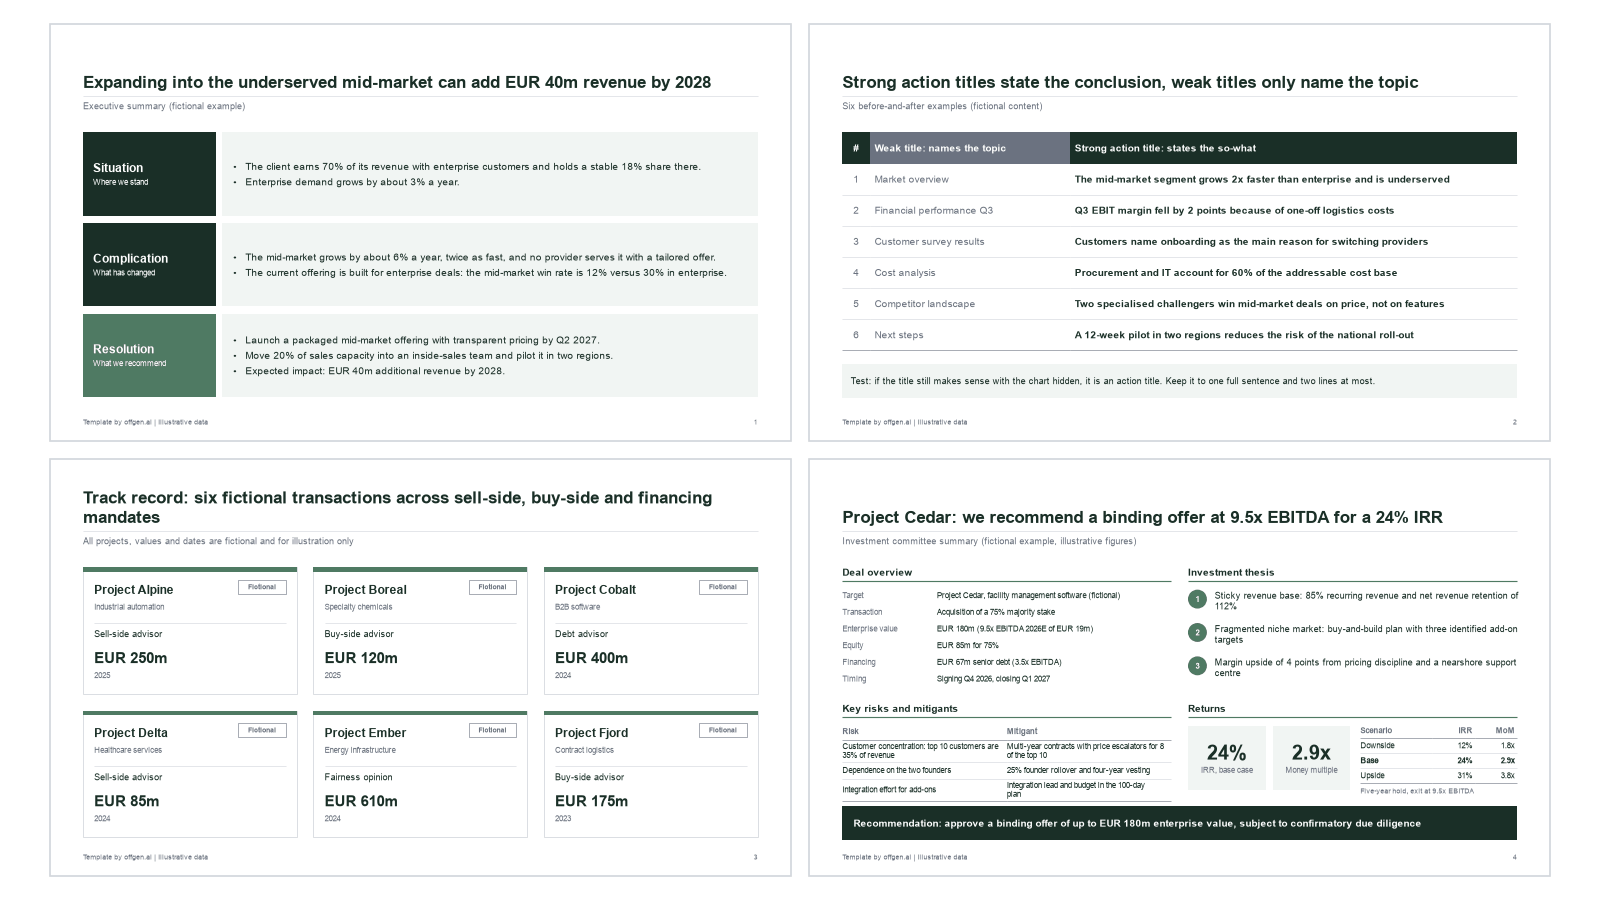
Preview from the free slide pack.
Why consulting decks use action titles
People search for "McKinsey slide titles" because the convention is closely associated with strategy consulting. Its best-known foundation is the Pyramid Principle by Barbara Minto, who was the first female MBA professional hire at McKinsey and worked there from 1963 to 1973, according to a McKinsey alumni profile. Minto's own summary of the method is that thinking is easy to grasp when ideas are organised as a pyramid under a single point. The action title is that single point at slide level.
There is also research behind the habit. Penn State's engineering communications program compares the "assertion-evidence" structure, a sentence headline stating the main message supported by visual evidence, with topic-phrase headlines over bullet lists. In the study by Garner, Alley, Wolfe and Sawarynski (International Journal of Engineering Education, 2013), the audience that saw assertion-evidence slides understood and remembered the content better, and the difference was statistically significant, as the program's research page reports. It was a student audience in a technical subject, so treat it as supportive evidence rather than a law of business communication.
The practical reasons matter more in daily work:
- Senior readers skim. A partner or client executive often reads only the titles and the executive summary.
- Review gets faster. A specific claim can be accepted, challenged, or sent back for evidence. A topic label cannot.
- Decks travel. Slides are forwarded without the presenter. The title has to carry the point alone.
The five tests of a good action title
| Test | Question to ask | Fails when |
|---|---|---|
| 1. States the so-what | Does the title say what the finding means, not just what the slide is about? | It names a topic, a method, or a data source |
| 2. Specific and falsifiable | Could a well-informed reader disagree with it? | It uses words such as "significant", "various", "key" without content |
| 3. Supported by the exhibit | Does the chart or table on this slide prove every part of the sentence? | The title claims a cause, trend, or number the exhibit does not show |
| 4. One to two lines | Does it fit in two lines at the template's title size? | It needs three lines or a smaller font |
| 5. Readable in sequence | Do the titles, read in order, form an argument? | Titles repeat each other, jump, or contradict the next slide |
The fifth test is what consultants call horizontal logic: the titles read across the deck tell the story. Vertical logic is the third test applied to every slide: the body proves its own title. Michael Alley's assertion-evidence tutorial makes the same point from the science side: each message should be a complete sentence serving as the slide headline, and the messages together should tell a coherent story.
A title that passes tests 1 to 4 but fails test 5 is a good sentence in the wrong deck. A deck with perfect horizontal logic and weak vertical logic is a persuasive story nobody can verify.
A formula: insight, magnitude, implication
Most strong action titles combine three parts:
Insight (what is true) + magnitude (how much, compared to what) + implication (what it means for the decision).
"Indirect costs grew three times faster than revenue (insight and magnitude) and now block the margin target (implication)."
Not every title needs all three. Use the variation that fits the slide's job:
| Pattern | Template | Example |
|---|---|---|
| Insight + magnitude | [Subject] [changed] by [amount] [over period] | Churn doubled to 14% in the six months after the price change |
| Insight + implication | [Finding], so [consequence for the decision] | Buyers decide on implementation speed, so the pitch should lead with delivery time |
| Contrast | [A], but [B] | List prices sit above peers, but realised prices are below them after discounts |
| Cause and effect | [Driver] explains [share] of [outcome] | Two late handoffs explain most of the 19-day lead time |
| Comparison | [Option or unit A] delivers [X] versus [B] | Option B delivers most of Option A's value at half the investment |
| Recommendation + reason | [Do X] because [main reason] | Enter through a partner first because own offices only pay back above €20m revenue |
| Condition | [Outcome] holds as long as [assumption] | The business case stays positive as long as utilisation stays above 72% |
| Status + consequence | [Status], which means [decision or risk] | Data access is two weeks late, which puts the January decision at risk |
Two rules keep the formula honest. First, take the magnitude from the exhibit, not from memory. Second, if the evidence is directional rather than precise, say so ("most", "the largest share") and make sure the chart shows it.
30 before-and-after examples by slide type
All examples are fictional and the numbers are illustrative. They show the pattern, not real market data.
Market slides
| # | Weak | Strong | Why it works |
|---|---|---|---|
| 1 | Market overview | The mid-market segment grows twice as fast as enterprise and becomes the larger pool by 2029 | Comparison, magnitude, and a time horizon in one line |
| 2 | Market size and growth | The addressable market is €2.4bn, but only €0.9bn is reachable through today's channels | Separates theoretical size from the realistic prize |
| 3 | Competitive landscape | Three regional players have taken 8 points of share since 2023 by competing on delivery speed | Names the mechanism, not only the movement |
| 4 | Market trends | Regulation, not technology, drives most new demand through 2028 | Ranks the drivers, which invites useful challenge |
| 5 | Pricing benchmark | Our list prices sit 12% above peers, yet realised prices end 4% below after discounts | The contrast points straight to discount discipline |
Customer slides
| # | Weak | Strong | Why it works |
|---|---|---|---|
| 6 | Customer survey results | Buyers rank implementation speed above price, while our pitch leads with price | Links the finding to a gap the client can close |
| 7 | Customer segmentation | Two of five segments generate 70% of margin and are underserved by the current offer | Quantifies priority and states the problem |
| 8 | Churn analysis | Churn concentrates in the first 90 days, so onboarding is the lever, not loyalty pricing | Rules out the tempting but wrong fix |
| 9 | Customer satisfaction | Satisfaction among key accounts fell 11 points after the support model changed in Q2 | Ties the drop to a specific event the exhibit can show |
Financial slides
| # | Weak | Strong | Why it works |
|---|---|---|---|
| 10 | Revenue development | Revenue grew 6%, but all of it came from price while volume fell for the third year | Decomposes the headline number |
| 11 | EBITDA bridge | Labour cost inflation absorbed two thirds of the margin gained from pricing | Says which bar in the bridge matters |
| 12 | Cost structure | Indirect costs grew three times faster than revenue and now exceed 22% of sales | Rate comparison plus a threshold a CFO recognises |
| 13 | Business case | The base case pays back in 26 months, and even the downside case pays back within four years | Gives the answer and its robustness together |
| 14 | Sensitivity analysis | Utilisation is the only assumption that can turn the business case negative | Tells the reader which variable to scrutinise |
Operations slides
| # | Weak | Strong | Why it works |
|---|---|---|---|
| 15 | Process overview | Order-to-delivery takes 19 days, of which only 3 are actual production time | Makes waste visible with one ratio |
| 16 | Plant benchmarking | Plant B produces at 30% lower unit cost on the same equipment, mainly through shift planning | Isolates the cause by holding equipment constant |
| 17 | Capacity analysis | Current capacity covers demand until Q3 2027; after that a third shift or outsourcing is needed | Turns a chart into a decision deadline |
| 18 | IT landscape | Six overlapping order-entry systems create duplicate data and block automation | States the consequence, not just the inventory |
Recommendation slides
| # | Weak | Strong | Why it works |
|---|---|---|---|
| 19 | Recommendation | Enter the Nordic market through a partner in 2027 and defer own offices until revenue passes €20m | Action, route, timing, and trigger |
| 20 | Options assessment | Option B delivers 80% of Option A's value at half the investment and lower execution risk | The comparison is the recommendation |
| 21 | Proposed organisation | Merging the two regional sales teams removes duplicate coverage without changing key-account owners | Pre-empts the main objection |
| 22 | Implementation roadmap | A three-wave rollout captures quick wins within six months and defers the system change until the pilot proves value | Explains the logic of the sequence |
Status and next steps slides
| # | Weak | Strong | Why it works |
|---|---|---|---|
| 23 | Project status | Workstreams A and B are on track; delayed data access puts the pricing analysis two weeks behind | Leads with the exception that needs attention |
| 24 | Next steps | Three decisions by 15 November keep the January launch achievable | Converts a to-do list into an ask |
| 25 | Open issues | Two unresolved data questions block the final business case and need a Finance owner this week | Names the blocker and the owner type |
| 26 | Steering committee update | The pilot met its adoption target, so the committee can approve the scope of wave two | States what the meeting should decide |
Due diligence slides
| # | Weak | Strong | Why it works |
|---|---|---|---|
| 27 | Commercial due diligence summary | The plan's 9% annual growth is achievable only if price increases hold, which the market has not accepted before | Accepts the headline and flags the condition |
| 28 | Customer concentration | The top three customers account for 41% of revenue, and two contracts renew within 12 months of closing | Connects concentration to timing risk |
| 29 | Management case review | Margin expansion in the management case relies on savings that are not yet contracted | Separates committed from hoped-for value |
| 30 | Quality of earnings | Adjusted EBITDA falls by €3.1m once recurring advisory fees are no longer treated as one-off | Quantifies the adjustment the buyer will price |
For investment committee pages, the investment committee presentation template shows how these titles sit inside a full decision memo structure.
The ghost deck: write the titles before the slides
A ghost deck is a draft deck that contains only action titles and a rough note of the exhibit each slide will need. It is written before the analysis is finished, often on day one or two of a project.
- Start from the decision question and the governing answer. If they are unclear, go back to the Pyramid Principle first.
- Create one blank slide per supporting point. Write the title as the claim you expect to prove.
- Sketch the exhibit in words. "Bar chart: churn by tenure month, source CRM export, last 24 months."
- Mark each title as hypothesis or proven. A simple tag in the slide notes is enough.
- Read the title sequence. Gaps and overlaps in the storyline become obvious before anyone builds a chart. The MECE checks help here.
- Use the exhibit notes as the analysis plan. Each note becomes a work package with an owner.
- Rewrite titles when evidence arrives. If the data contradicts the title, change the title, not the chart.
The risk is confirmation bias. A ghost deck written with confidence can push a team to look only for supporting data. The hypothesis tag and step 7 exist to prevent that.
How to test your titles
- Read only the titles aloud, in order. PowerPoint's Outline view shows the titles and main text of each slide and can be printed with the Outline layout. If the spoken sequence does not make an argument, fix the storyline before the slides.
- Cover the body, read the title. Predict what exhibit should follow. If you cannot, the title is too vague.
- Cover the title, read the body. Write the title you would give the exhibit. If it differs from the actual title, one of them is wrong.
- Ask "so what?" once more. If the answer adds something important, it probably belongs in the title.
- Check every number against the exhibit. Same unit, same period, same rounding.
- Check uniqueness. Microsoft's accessibility guidance asks for a unique title on every slide because screen reader users rely on slide titles. Its Accessibility Checker finds slides without titles, which often means the action title sits in a free text box instead of the title placeholder.
The full release review, including numbers, sources, and confidentiality, belongs in the consulting presentation checklist.
Common mistakes and how to fix them
| Mistake | Example | Fix |
|---|---|---|
| Topic label dressed as a sentence | An overview of the current market situation | State what the overview shows |
| Method instead of finding | We interviewed 25 customers in four countries | Put the method in the footnote; title the result |
| Over-claiming | Pricing causes churn (chart shows correlation only) | Match the verb to the evidence: "coincides with", "explains most of" |
| Three messages in one title | Costs rose, margins fell and the team needs restructuring | Split into slides or keep the one the exhibit proves |
| Empty intensifiers | Significant improvement potential in key areas | Replace with the amount and the area |
| Hedging everything | Could potentially indicate a possible opportunity | Commit to the claim or label it a hypothesis |
| Inconsistent numbers | 14% churn on one slide, 13.6% on the next | One source, one rounding rule for the deck |
| Stale titles | The title still quotes last month's figure after a data refresh | Re-check titles every time the exhibit data changes |
| Questions as titles | Where should we grow? | Use questions only for section dividers; answer them on content slides |
Using AI to draft and critique action titles
Language models are good at turning a table into a crisp sentence and at spotting topic titles in a long deck. They are also good at producing specific-sounding numbers that are not in the data. The magnitude part of the formula is exactly where invented facts slip in, so the prompt must restrict the model to approved inputs.
Prompt 1: draft from the exhibit data
Here is the data behind one slide, followed by the decision question of the deck. Write three alternative action titles of at most 20 words each. Use only numbers that appear in the data. After each title, name the data points that support every number and claim in it. If the data does not support an implication, write the title without one and say what evidence is missing.
Prompt 2: critique a title sequence
Below are the slide titles of a deck in order. For each title, apply five tests: states the so-what, specific enough to disagree with, supportable by a single exhibit, at most two lines, consistent with the titles before and after it. Flag topic titles, method titles, and unsupported causal claims. Then read the titles as one storyline and list gaps, overlaps, and jumps. Do not rewrite yet.
Prompt 3: rewrite to house style
Rewrite the flagged titles. Keep each under 20 words, use active verbs, keep units and periods consistent with the rest of the deck, and do not add facts that are not in the original title or the attached data.
Approved facts matter because a fluent title is persuasive even when it is wrong. Feed the model the exhibit data, the approved source list, and the house style. Then a consultant checks every number before the title reaches a client. In offgen, these restrictions live in the skill itself, so nobody has to paste them into a prompt. The broader guide to AI for consulting firms explains why drafting and critique are safer starting points than automated recommendations.
Free download: consulting slide pack
The consulting slide pack contains six editable slides with illustrative data:
- an executive summary in Situation, Complication, Resolution form;
- a weak versus strong action titles table for team training;
- a tombstone grid for credentials;
- an investment committee summary slide;
- an issue tree;
- a next steps table with owners and dates.
All text, tables, and shapes are editable. Replace the sample content and apply your own master before client use, or let offgen draft these slides in your master directly.
Draft answer-first slides in your own master with offgen
Writing 30 good titles takes practice. Getting them into every deck, on every project, takes a process. offgen makes the process automatic: each draft arrives with conclusion-led titles, in your firm's master, ready for review.
- Title rules per slide element. In the Structured Skill Builder, you set fill rules for tone, length, content requirements and allowed source material. "A complete sentence of at most two lines, numbers only from the approved sources" then applies to every deck the skill generates.
- Your master from the first draft. offgen captures your CI, layouts, title logic and slide patterns, and delivers native, editable PowerPoint.
- One skill per deck type. Steering committee updates, proposals, recurring client reports: configure each once, publish it to the team, and update the rules as your house style improves.
- Facts from approved sources. Fill rules define which material a skill may use, so the magnitude in each title comes from your data.
The consultant still owns the so-what and the final read of the title sequence; offgen removes the rebuilding and reformatting around it. Munich consultancy Cross Consult built offgen workflows for its recurring documents and replaced six location decks with one master workflow. More on consulting workflows is on the consulting industry page.
This guide was written by Florian Ploszczyk, offgen's co-founder and COO, who writes about consulting workflows and professional presentations.
Frequently asked questions
What is an action title on a slide?
An action title is a full-sentence slide headline that states the conclusion the slide proves, for example: churn concentrates in the first 90 days, so onboarding is the lever. A topic title such as Churn analysis only names the subject and leaves the reader to work out the point.
How long should an action title be?
One line is ideal and two lines is the practical limit at normal title size. In English that usually means about 10 to 20 words. If a title needs three lines, it is carrying more than one message or explaining the method instead of stating the finding.
Why are they called McKinsey slide titles?
The style is associated with strategy consulting, and its best-known foundation, the Pyramid Principle, was developed by Barbara Minto, who worked at McKinsey from 1963 to 1973. Many firms now use conclusion-led titles, so the convention is not specific to one company.
Should every slide have an action title?
Every content slide that makes a claim should. Cover pages, agendas, section dividers, and pure reference pages in the appendix can keep descriptive titles. Even then, give each slide a unique title, because screen readers and PowerPoint's Outline view rely on slide titles.
What is horizontal logic in a deck?
Horizontal logic means the action titles, read in order without the slide bodies, form a coherent argument. Vertical logic means each slide body proves its own title. A strong deck passes both: the titles tell the story and the exhibits support every claim.
Can AI write good action titles?
AI can draft and critique titles quickly when it receives the exhibit data and approved facts. Without them it tends to invent plausible numbers and implications. Ask it to cite the data point behind each number and have a consultant approve the final wording.
Sources
- 01The Minto Pyramid Principle and SCQ Framework — Minto Books International. Accessed 20 October 2026.
- 02The Pyramid Principle, third edition — Pearson, 2026-02-23. Accessed 20 October 2026.
- 03Barbara Minto: MECE, I invented it, so I get to say how to pronounce it — McKinsey & Company Alumni. Accessed 20 October 2026.
- 04Research on scientific presentations and the assertion-evidence approach — Penn State College of Engineering, Engineering Communications Program. Accessed 20 October 2026.
- 05Assertion-evidence tutorial — The Craft of Scientific Communication (Michael Alley, Penn State). Accessed 20 October 2026.
- 06Create and print a presentation in Outline view — Microsoft Support. Accessed 20 October 2026.
- 07Make your PowerPoint presentations accessible to people with disabilities — Microsoft Support. Accessed 20 October 2026.
- 08Structured Skill Builder — offgen. Accessed 20 October 2026.
Related articles
Consulting
The Pyramid Principle in PowerPoint: A Worked Example for Consultants
Read articleConsulting
MECE Storylining for Consulting Presentations: Examples and Checklist
Read articleConsulting
Consulting Presentation Checklist: 40 Checks Before Client Delivery
Read articleConsulting
Consulting Slide Library Best Practices: Taxonomy, Ownership, and Reuse
Read article
About the author
Florian Ploszczyk
Co-Founder and COO, MD
Florian writes about consulting workflows, professional presentations, company knowledge, and the controlled adoption of agentic AI.